Below you’ll find information and resources about hunger here in Kansas, including Feeding America’s newly released Map the Meal Gap interactive map of food insecurity and a 2021 Hunger in the Heartland Hunger Study.
Map the Meal Gap
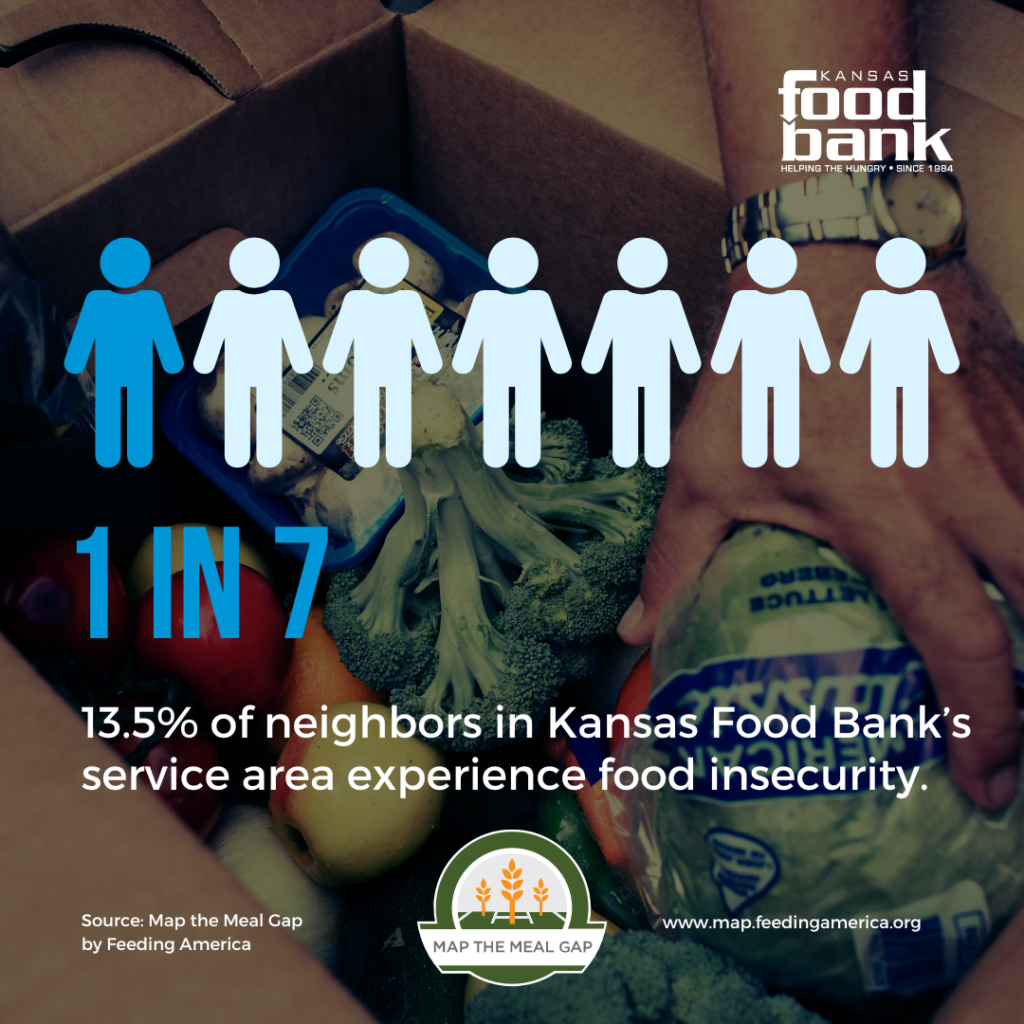
Data published in May 2024 from Feeding America’s Map the Meal Gap study completed in 2022 shows that food insecurity rates are increasing, with food insecurity present in 100% of the counties across the United States, and right here in Kansas is no different.
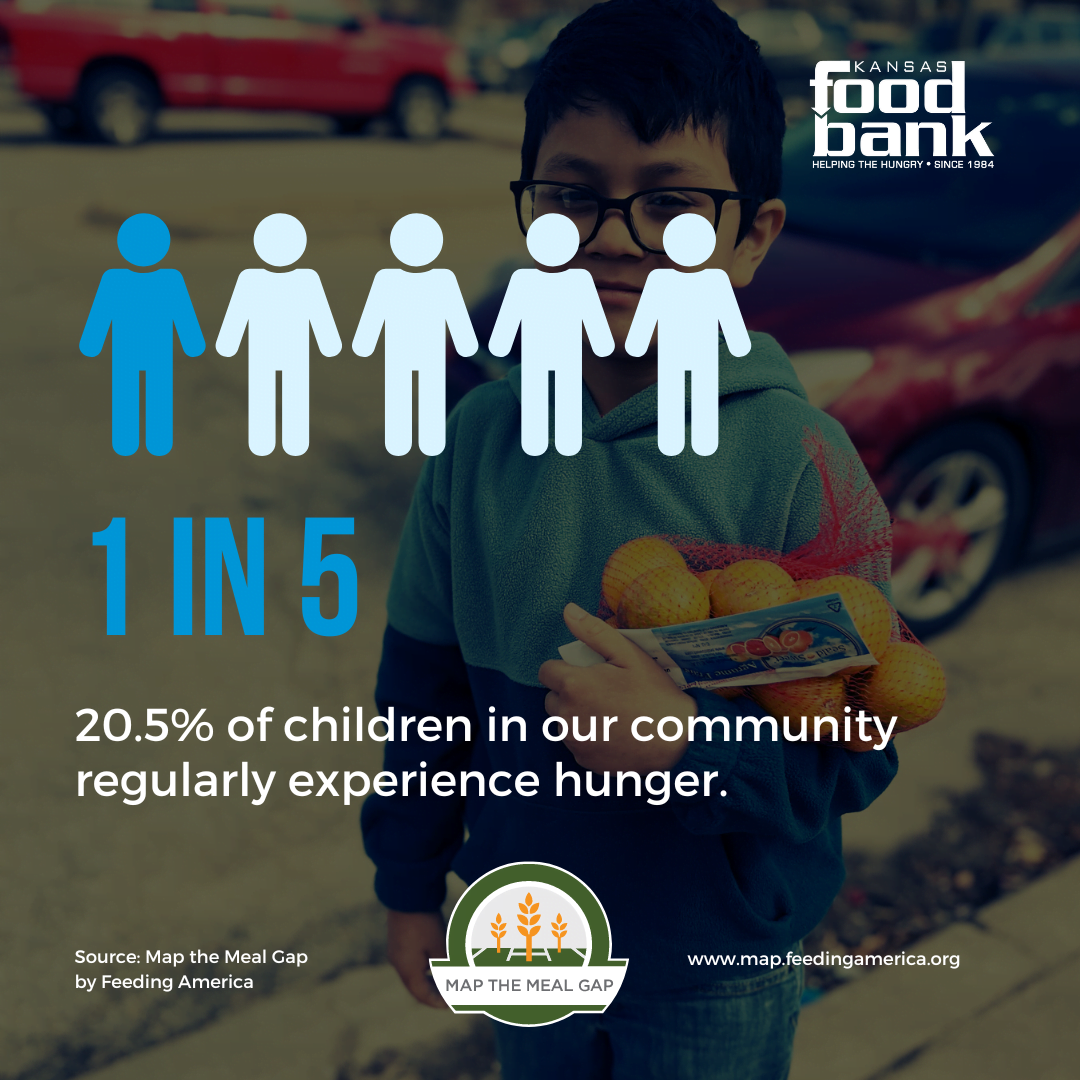
In our 85-county service area, food insecurity rates have increased from 10.3% in 2021 to 13.5% in 2022, while childhood hunger soars to 20.5%, up from 14.7% in 2021. The Kansas Food Bank is committed to doing all we can to meet this increased need.
Feeding America recently conducted their annual Map the Meal Gap study to improve our understanding of food insecurity and food costs at the local level. The most recent release is based on data from 2022. To better assess the current and future state of local food insecurity, it is critical to understand historical variations prior to the pandemic. Only then can we develop effective strategies to reach people at risk of hunger.
Click below to open the map, where you’ll be able to explore the data on a county-by-county basis.

Hunger In the Heartland 2021

This is an unprecedented study of the Kansas Food Bank and its pantry partners. It is a comprehensive look at our neighbors who face food insecurity and the pantries that serve them.
- Kansas Food Bank worked with the University of Missouri’s Interdisciplinary Center for Food Security to examine the impacts of hunger and the difficult choices many people face to make ends meet.
- This study illustrates the critical role the Kansas Food Bank and pantries play in supplying food to struggling families. (47% of households served get at least half of their monthly food from a food pantry).
- Kansas Food Bank pantries serve over 945,000 people annually.
- The working poor make up half of the people served by food pantries.
- Hunger is linked to a series of health problems, including diabetes, hypertension, and high cholesterol.
- There are significant gaps in nutrition safety net program participation.
Key Findings for the 85 Counties Covered by The Kansas Food Bank
- 39% of households had to choose between paying for food and medicine/medical care
- 48% had to choose between food and utilities
- 39% consumed food past its expiration date
- 33% had to choose between paying for food and housing
- 25% sold or pawned personal items to pay for food
- 50% of households have at least one working adult
- 63% of clients surveyed are white
- 37% of households have at least one adult over the age of 65
- 45% have at least one child under the age of 18
- 79% of clients surveyed have a high-school degree or higher level of education
- 14% include a military veteran
- 60% of households served purchased the least expensive food in the past 12 months, even if it wasn’t the healthiest option
- 43% have a member with diabetes or pre-diabetes
- 62% have a member with high blood pressure
- 46% have a member with no health insurance of any kind
- 82% of households served have incomes that make them eligible for SNAP, but only 41% participate
- 38% of households with children 5 and under used WIC in the previous year.
- 67% with children under 18 participate in free or reduced-price breakfast or lunch.
Further Reading / Downloads