
Hunger Statistics
Largest, Most Comprehensive Analysis of Charitable Food Assistance in America Reports more than 215,000 Served by Kansas Food Bank Annually
WICHITA – August 18, 2014 – A new study by the Kansas Food Bank and Feeding America shows that 1 in 7 people, or an estimated 215,300 people, in the Kansas Food Bank’s service area turn to food pantries and meal service programs to feed themselves and their families. This includes 68,900 children and 19,900 seniors.
The Hunger in America 2014 local findings show that 22,100 people are served each week by agencies supported through the Kansas Food Bank. Accounting for multiple agency visits, 1,468,900 clients turned to Kansas Food Bank network agencies over the course of the year. This means clients are visiting Kansas Food Bank network agencies an average of 7 times a year.
The study documents household demographics and offers a snapshot of the people served by the Kansas Food Bank – their circumstances, the challenges they face and the choices they are forced to make living on extremely limited household incomes. It is also the first nationally-representative study that assesses the prevalence of past and current members of the U.S. Military and adult students receiving charitable food assistance.
Key statistics from the report for the Kansas Food Bank service area include:
WIDESPREAD USE OF FOOD ASSISTANCE
- Kansas Food Bank serves 215,300 people annually, including 68,900 children and 19,900 seniors.
- Among all clients, 14 percent are black, 37 percent are Latino, and 42 percent are white.
- 11 percent of adult clients are students.
- 14 percent of households include someone who is a veteran or who has ever served in the military.
CLIENTS STRUGGLING WITH HEALTH ISSUES
- 82 percent of households report purchasing inexpensive, unhealthy food because they could not afford healthier options.
- 66 percent of households report having to choose between paying for food and paying for medicine or medical care.
- 27 percent of households include a member with diabetes.
- 48 percent households have a member with high blood pressure.
MAKING TOUGH CHOICES AND TRADE-OFFS TO KEEP FOOD ON THE TABLE
Following are the choices client households reported making in the past 12 months:
- 71 percent report choosing between paying for food and paying for utilities.
- 35 percent of these households are making the choice every month.
- 73 percent report making choices between paying for food and paying for transportation.
- 35 percent of these households are making the choice every month.
- 66 percent report choosing between paying for food and paying for medicine/medical care.
- 30 percent of these households are making the choice every month.
- 60 percent report choosing between paying for food and paying for housing.
- 28 percent of these households are making the choice every month.
- 31 percent report choosing between paying for food and paying for education expenses.
- 15 percent are making the choice every month.
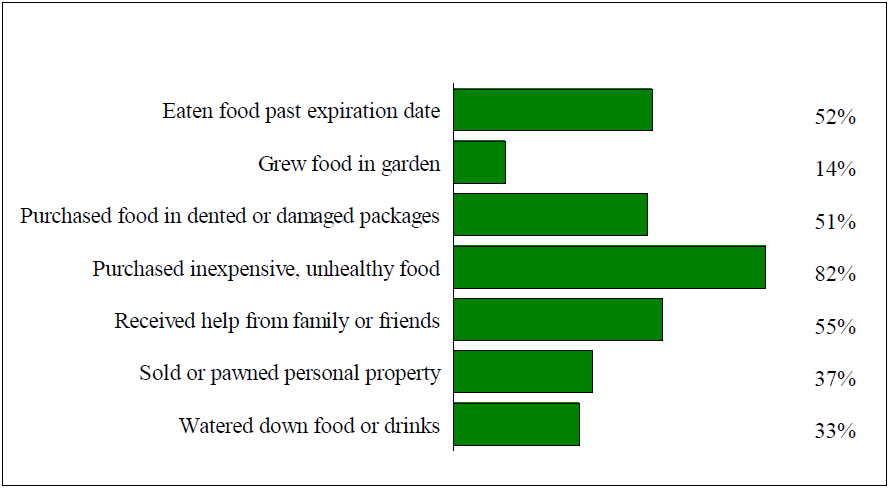
More than half of households reported using three or more coping strategies for getting enough food in the past 12 months. The frequency of these strategies among all households include:
- 52 percent report eating food past the expiration date;
- 14 percent report growing food in a garden;
- 37 percent report pawning or selling personal property;
- 82 percent report purchasing inexpensive, unhealthy food;
- 33 percent report watering down food or drinks;
- 55 percent report receiving help from friends or family.
LOW WAGES, UNDEREMPLOYMENT AND UNEMPLOYMENT DRIVING NEED
- 12 percent of respondents have faced foreclosure or eviction in the past five years.
- Among all households served by Kansas Food Bank agencies and programs, 60 percent have at least one member who has been employed in the past year.
- 47 percent of all households with an employed person, the person with the longest employment duration, is likely to only be employed part-time.
Hunger in America 2014 was conducted using rigorous academic research standards and was peer reviewed by a technical advisory team including researchers from American University, University of Illinois at Champaign-Urbana and the Urban Institute. Nationally, confidential responses were collected on electronic tablets by 6,000 trained volunteer data collectors.
The study was funded by The Howard G. Buffett Foundation.
Unprecedented New Study Paints a Detailed Portrait of Food Insecurity in Kansas
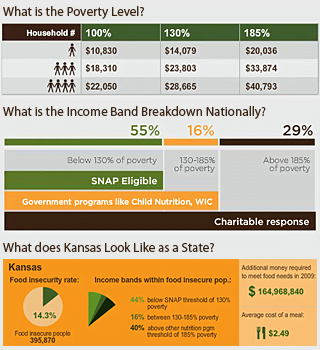
WICHITA – March 24, 2011 – The Kansas Food Bank and Feeding America, the nation’s largest domestic hunger-relief organization, today released a landmark study, “Map the Meal Gap,” providing the first detailed look at the food budget needed by families struggling with hunger here in Kansas each year – an estimated $164,968,840.
The study takes a look at ‘meals’ in a whole new way, using county-level data on food costs from The Nielsen Company to break down the food budget shortfall of our residents into an approximation of the meals missing from the tables of people at risk of hunger in Kansas each year.
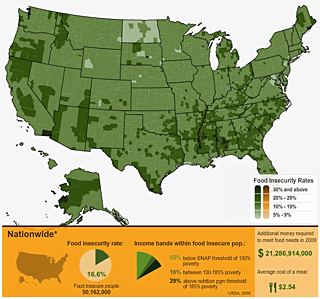
Map the Meal Gap provides the following data for Kansas in an interactive map format:
- The percentage of the Kansas population who is food insecure.
- The percentage of the food insecure population in Kansas who qualify based on income for SNAP (Foods Stamps) and other federal nutrition programs.
- The percentage of the food insecure population in Kansas who do NOT qualify for federal nutrition programs and often must rely on charitable food assistance programs and who also need better wages and employment opportunities to help them meet their basic needs.
- The average price per meal in Kansas, based on new research by The Nielsen Company.
The interactive map will, for the first time, allow policy makers, state agencies, corporate partners and individual advocates to develop integrated strategies to fight hunger on a community by community level.
According to Census Bureau’s Current Population Survey data analyzed as part of “Map the Meal Gap”, people struggling with hunger estimate they would need about $56 more each month on average during the months that they are food insecure to address the shortages in their food budget. On a county by county level, “Map the Meal Gap” shows that this shortfall represents an estimated 66,252,546 meals in Kansas on an annual basis.
“Map the Meal Gap” also provides critical information that has never been previously available — food insecurity rates for Congressional District. Previously, food insecurity data was only available at the state level in the USDA’s annual report. The study further analyzes each district’s food insecure population to determine their income eligibility for federal nutrition assistance. This data has the potential to redefine the way service providers and policy makers address areas of need.
The findings of “Map the Meal Gap” are based on statistics collected by the U.S. Department of Agriculture, U.S. Census Bureau, and food price data from The Nielsen Company. The study was supported by The Howard G. Buffett Foundation and Nielsen.
“Map the Meal Gap” was conducted using well-established, transparent methods. Data were analyzed by Feeding America in partnership with Dr. Craig Gundersen, Associate Professor of Agricultural and Consumer Economics at the University of Illinois, Executive Director of the National Soybean Research Laboratory and member of Feeding America’s Technical Advisory Group.
More information on hunger in Kansas can be found at these websites: